


Recently I’ve shared a couple of infographics in my blog posts. Our readers like them very much. Some asked me what an infographic is and how to make an infographic. In this blog post, I will explain what an infographic is and how to make an inforgraphic yourself using free infographic tools.
What is an infographic?

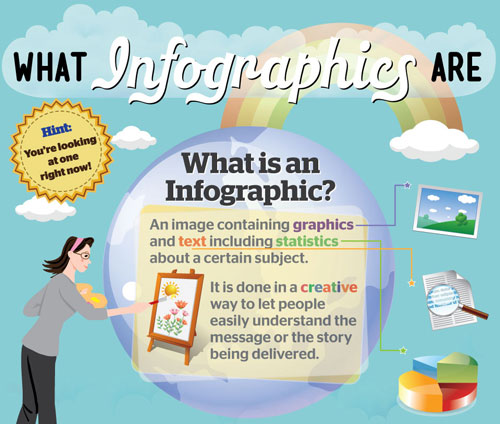
Image source: infographiclabs.com
An infographic is also called information graphic. It is an image using graphics and text to visually organize and represent information, data and knowledge around a specific subject. It helps readers quickly grasp the main points of the subject without lengthy reading. The graphics used are usually fun and easy to remember.
Content marketing is still the trend for online marketing in 2019. As one of the forms of content, infographics have become increasingly popular. They can easily be embeded on your website and shared among social media sites such as Pinterest, Instagram to build strong backlinks and bring traffic.
How to make an infographic?
The process of making an infographic involves collecting, sorting, arranging and presenting information and data visually. To make your own infographic, you need to:
1. think of a topic for your infographic and create an outline.
2. collect data and information related to your topic
3. choose an eye-friendly color scheme and attention-grabbing graphics
Free infographic tools to make infographics:
Many people think it is expensive and hard to make an infographic. Actually, it is not. Thanks to the free infographic tools available online, you don’t have to be a graphic designer to make your own infographic. Here are several popular free infographic tools for you:
- Visual.ly
Create free custom infographics in seconds with Visual.ly Create. Visually has templates that allow you to instantly create very cool infographics based around Twitter or Facebook data. For example, Twitter Account Showdown and Facebook Monsterizer. You can also search for the latest infographics on visual.ly to get new ideas and inspiration.
- Piktochart.com
Piktochart is my favourite one. It offers a free package for casual users with three free themes. You can change colour schemes, fonts, add basic shapes, pre-loaded graphics and upload your own images. Piktochart Pro package is $29 per month. You get 100 professional themes and more customization options.
- Infogr.am
It has six templates for you to use. You can insert your data into each of Infogr.am’s pre-set boxes, or you can delete or add boxes. There are more than a dozen graphic options for you to choose from. You can add text boxes, photos, maps and even video. The infographics you made can be easily shared through social media or use the embed code to place it on your own website.
- Easel.ly
Easel.ly is still in beta. You don’t need to register to play with it. You can work with any of the free templates or start with a blank canvas. If you do not like the objects on a template, replace them with graphics from object categories which have an animal, people, nature, food and other icons. You can choose shape, text and background on the top menu bar. You can also upload your own graphics.
Now you know what is an infographic and how to create your own infographic using free tools available online. Go ahead to create one!


Great topic and very interesting content, thanks a lot.
Very interesting and helpful. I will apply on my website too. Thank you again for sharing your expertise and looking forward to seeing your more blogs.
Thank you , Mary. This information is really helpfull, now I can make my infographic on my website.
Thanks so much for the information on info graphics
I think this is really cool.