


Do you know the performance of your website? Do you know where the traffic is coming from? Social media, paid advertising, organic search . . . which traffic source is more effective? What did the visitors do on your website? Did they do what you wanted them to?
Google Analytics is a free tool that keeps track of the performance of your website or mobile app. By simply adding a tiny piece of tracking code to your website, you can find all the answers from Google Analytics. Google Analytics provides you with insights about your online business. It helps you evaluate the effectiveness of your marketing efforts, better understand your target audience and optimize the performance of your website.
Google Analytics can be daunting to many people. The good news is that once you understand the basics of Google Analytics, it is a lot easier to get started and take advantage of this useful tool.
In a nutshell, Google Analytics studies the visitors to your website, mobile site or mobile app (Audience), what brought them on your website (Acquisition), what they did on your website (Behavior) and if they did what you wanted them to (Conversion).
Let’s go over the ABCs of Google Analytics one by one.
Audience: Who is your target audience?
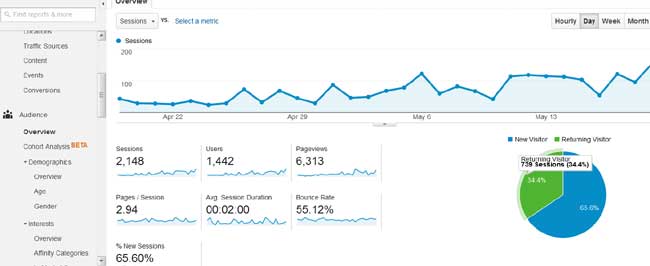
The Audience reports show you the demographics of the audience, their interests, location, behavior, and what device they use, etc. It helps you better understand the characteristic of your target audience and tailor your marketing messages to them.
Here are several metrics that are used in Audience overview report:
- Sessions – The total number of visitor “sessions” to your site
- Users – The total number of unique visitors to your site
- Pageviews – The total number of pages viewed on your site
- Pages per Session – The average number of pages viewed per session (visit)
- Average Session Duration – The average amount of time visitors stay on your site
- Bounce Rate – Percentage of visitors that leave your site after viewing only one page
- New Users – Percentage of total visitors who arrived at your site for the first time
Acquisition: What brought visitors to your site?
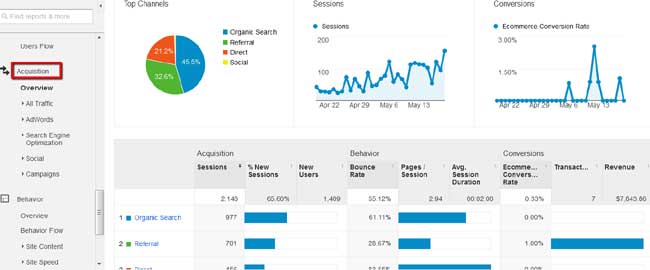
The acquisition reports show which channels brought visitors to your website, mobile site and mobile app. Here are 5 major channels:
- Organic Search: Visitors who come to your website after searching Google.com and other search engines
- Paid Search: Visitors who come to your website from an AdWords or other paid search ad
- Direct: Visitors who come to your website by typing your URL into their address bar or using a bookmark on their browser
- Referral: Visitors who come to your website from another website by clicking on a link
- Social: Visitors who come to your website from a social network
With the help of Acquisition reports, you can easily compare the traffic from different channels and find out which channel is more effective.
Behavior: What did the visitors do once they got there?
The Behavior Reports show you what your visitors do once they are on your website. The information on site speed and site search helps you improve your website SEO. Behavior Flow chart displays how the visitors interact with different pages on your site by going from one page to another. At what point, they leave your site. This information can help you work on the engagement of your site.

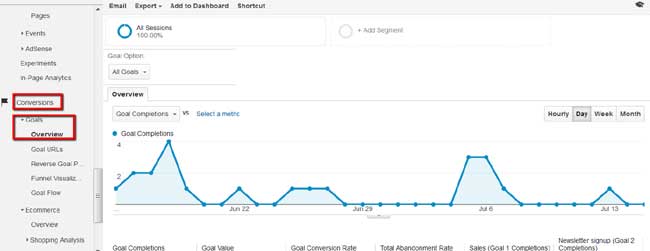
Conversion: Did they do what you wanted them to do?
The Conversion reports keep track of the performance of your marketing efforts. You can set up Google Analytics goals and turn on eCommerce tracking to monitor how many people join your list, how many transactions you get and the total revenue of the sales, etc.
Now you have the basic understanding of Google Analytics. Go ahead to set up Google Analytics tracking on your website and start to monitor the performance of your website.

